Google recently made headlines when it announced a new ranking factor for 2021: page experience. User experience has always been a crucial component in creating the best site possible, but it will now play an even bigger role in assisting you in creating amazing sites for your customers. All of this is fueled by new metrics, the most important of which is the Core Web Vitals. It’s time to get to know LCP, FID, and CLS!
The Updated Google Page Experience Powered by Web Vitals
In general, site speed metrics are difficult to comprehend and decipher. Furthermore, they appear to shift slightly each time you test your website. It’s not always possible to get the same results. It’s safe to suggest that you just have to keep an eye on some numbers and hope they turn green.
Google has identified three “Core Web Vitals” out of all the possible metrics. In the coming year, these will be Google’s main focus. Google may add or update these metrics every year as they evaluate them over time.
The subset of Web Vitals that apply to all websites which should be assessed by all site managers and will be surfaced across all Google tools is known as Core Web Vitals. Each of the Core Web Vitals represents a unique aspect of the user experience, is field observable, and demonstrates real-world experience with a crucial user-centric outcome.
The Three Foundations of Page Experience
For the time being, the three foundations of page experience are:
- Loading performance (how quickly does content appear on the screen?)
- Responsiveness (how quickly does the page respond to user input?)
- Visual stability (does the content on the screen move around when loading?)
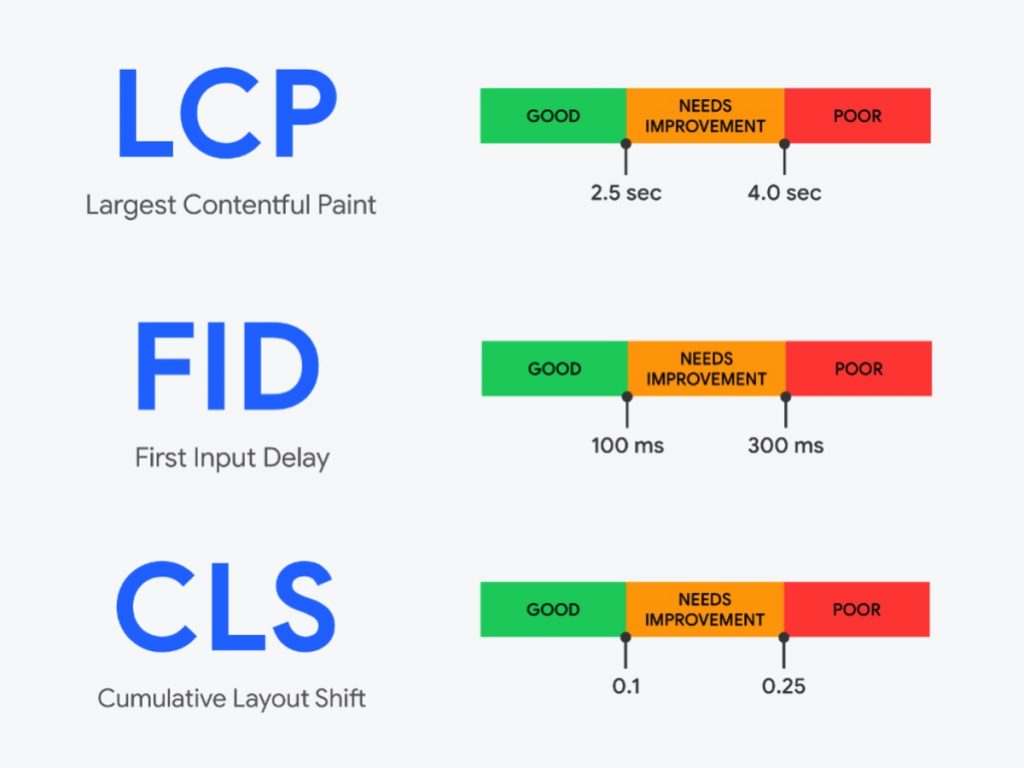
Google selected three corresponding metrics — called the Core Web Vitals — to calculate these important aspects of user experience:
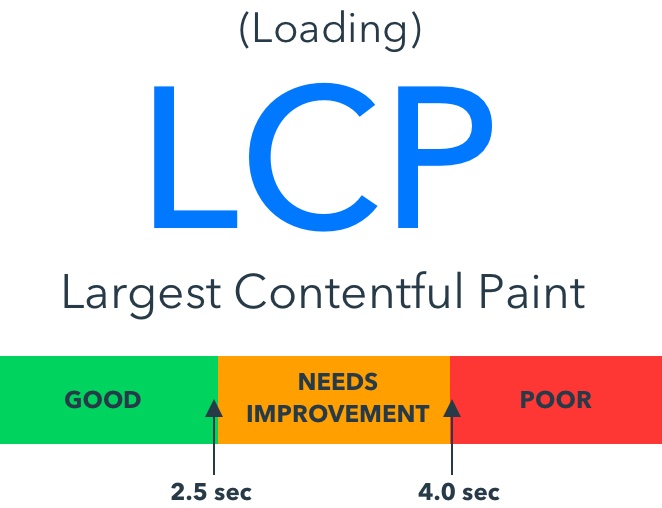
- LCP, or Largest Contentful Paint is a metric that calculates how long it takes for the largest piece of content on the screen to appear. This may be a picture or a paragraph of text. A high rating gives users the idea that the web loads quickly. A sluggish website can be aggravating.
- FIS, or First Input Delay is a metric that measures how long it takes for a website to react to a user’s first input. This may be as easy as pressing a button. A high score here indicates that a site is easy to respond to user feedback and, as a result, responsive. A slow site, once again, is a source of frustration.
- CLS, or Cumulative Layout Change is a metric that assesses the site’s visual stability. To put it in another way, does something move around on the screen as it loads, and if so, how often? There’s nothing more aggravating than having to press a button when a slow-loading ad appears in the same spot.
According to Google’s John Mueller, if you want your site to rank higher, all three metrics must be green. Of course, you shouldn’t optimize your site for green scores; however, getting green scores will undoubtedly benefit your guests. It’s all about happy guests — and, of course, great stuff!
Although the Page Experience update is already coming soon, it is unlikely to have a major effect right away. According to Google’s Danny Sullivan, it will be implemented progressively and could become more relevant over time.
Various Tools Use Different Metrics
Each page experience tool makes use of several Web Vitals obtained from different sources. Since each method serves a particular function, the metrics used vary. Nevertheless, Google uses the Core Web Vitals in each page experience tool, making it the common denominator.
But what do all these figures imply? What should you be looking for on your website? When will your website be fast enough? How will your site get a decent score? There is a slew of questions that could be asked about these figures. And, although Google is working to bridge the gap between awareness and progress, this is still a challenging subject to comprehend. Measuring site speed and user experience are difficult because there are too many variables to consider.
What Exactly Are These Core Web Vitals?
There are several other indicators in addition to the Core Web Vitals, so they don’t function in isolation. Some metrics are based on controlled lab experiments, while others are based solely on field results. Google came up with a new collection of metrics called Web Vitals after conducting numerous research. There are a mix of metrics we’re all familiar with, as well as a few new ones. The three Core Web Vitals are the most important and Google explicitly demands that site owners track these scores and boost them where possible.
- LCP, Largest Contentful Paint
The point on the screen where the largest content element appears is measured by the Largest Contentful Paint. Keep in mind that it just measures the time it takes to load the most important aspect of your page and not how long it takes to load fully.
The LCP would be the large image if you have a basic web page with only a piece of text and a large image. It’s bound to make an impact because this is the largest piece of content to load in the browser. Your site would appear much better if you can get it to load faster. As a result, sometimes it’s just a matter of optimizing the picture itself.
There used to be metrics like First Meaningful Content, which calculated the time it took for the user to see the first piece of content on the screen that was meaningful to them. Despite its name, the FMC metric had a hard time determining what was the most important thing on the page. Complex metrics like this often lead to useless data.
The concept of Largest Contentful Paint is simple: it is the time it takes for the largest element to appear on the screen. Photos, videos, and other forms of content may be included in these components.
What You Should Do
You should start optimizing for the LCP now that you know what it is. The LCP should occur within the first 2.5 seconds of the page loading, according to Google. Everything under 4 seconds needs to be improved, and everything above that is considered bad performance.
Since the first thing that loads may not automatically be the large image, the LCP is set to be dynamic. When the large image appears on the screen, the LCP switches to it.
Here’s a Google picture of how it works:
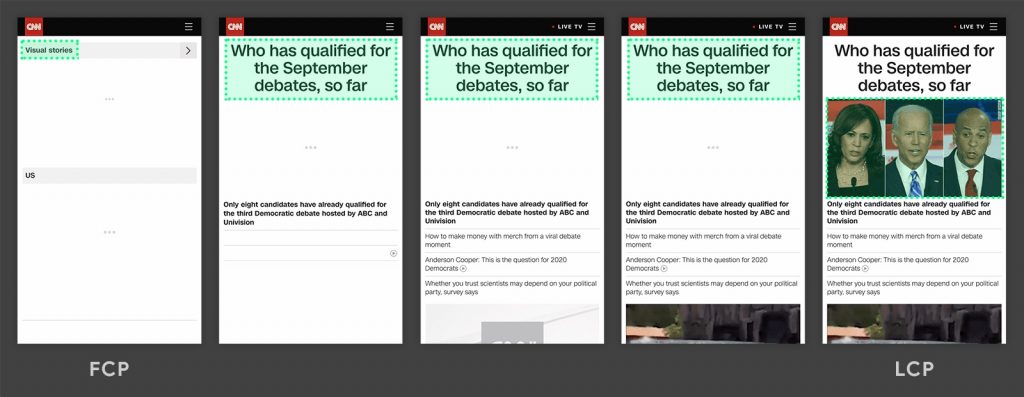
On the first photo on the left, the logo and the ‘Visual stories’ line appear first. The big headline appears as a candidate for LCP on the second screen. However, on the last screen, you can see that a large picture has taken over the header as LCP. If you just have one wide piece of material, it may as well be the LCP the whole time.
You can see why this is such a useful metric by looking at the image loading phase. You can easily identify the LCP and optimize that element’s loading.
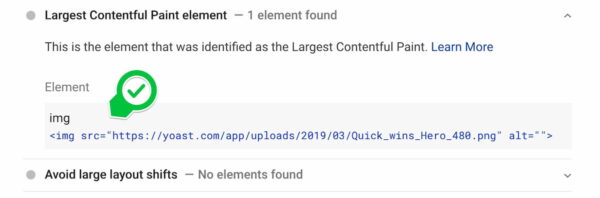
Google provides a range of resources to assist you in finding all of these elements. PageSpeed Insights, for example, contains a wealth of knowledge on Web Vitals as well as a lot of guidance on how to boost your website. When you run yoast.com via PageSpeed Insights, you can get various scores and suggestions. The LCP in this case was a big picture. PageSpeed Insights correctly identified the feature, as shown in the screenshot below. Now you know what you need to focus on!
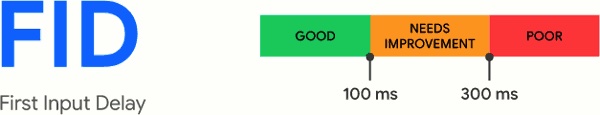
FID, First Input Delay
The time it takes for the browser to react to the user’s first input is measured by the First Input Delay. The page will become more responsive the faster the browser responds. If you want to have a good experience for your users, you should improve the responsiveness of your sites.
When the browser is also doing other work in the background, delays occur. So for example, the page has loaded, and everything appears to be in order. But nothing happens when you press the button! This is a negative experience that contributes to anger. Even if the delay is minor, it will cause your site to feel slow and unresponsive.
A browser must do a great deal of work, and it might be appropriate to briefly pause such requests before returning to them later. It won’t be able to do everything at once. We’re asking a lot from browsers as we create increasingly complex sites, which are mostly driven by JavaScript. We must concentrate on the FID to accelerate the process of placing content on the screen and making it interactive.
The FID counts all interactions that occur while the page is loading. Taps, buttons, and key presses are examples of input actions except for zooming and scrolling. To appear responsive, Google’s new metrics need an FID of less than 100ms. Everything between 100 and 300 milliseconds needs to be improved, and everything beyond that is considered bad performance.
What You Should Do
One thing to keep in mind is that you can’t calculate the FID until the user interacts with it. This means that Google can’t simply predict the FID using data from the lab. They’ll need data from actual users, or also called field data. This also means that this data is less controllable than lab data since it is collected from actual users in a variety of devices and settings. This is one of the reasons why data may appear to change from time to time.
If you want to boost your grades, JavaScript is often the cause of poor results. While JavaScript allows us to create incredible interactions, it can also result in slow websites with complex code. While executing JavaScript, the browser often cannot respond to user input. You’ll instantly boost your page experience scores if you improve your JavaScript code and how it is handled.
However, this is the most challenging part. Most websites will benefit greatly from reducing the time it takes to execute JavaScript, breaking up complex tasks, and eliminating unused JavaScript.
Yoast.com, for example, has a respectable ranking, but it’s not flawless. We are also plagued by mechanisms that restrict us from obtaining perfect scores. Some of these are difficult to repair, and others are needed for the proper operation of our website. Examine the results and see what you can do. Find the enhancements that are the simplest to implement or that result in the most significant performance gains.
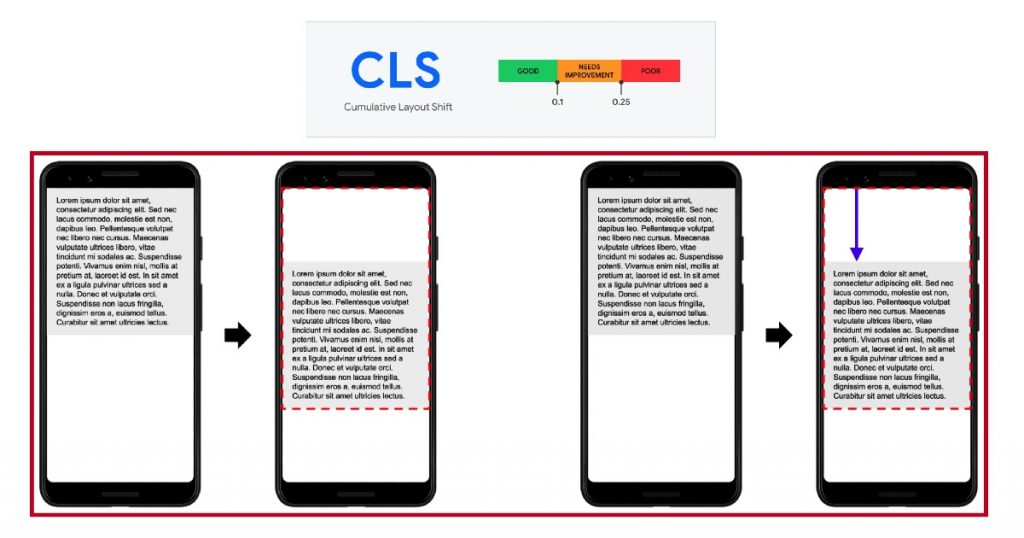
CLS, Cumulative Layout Shift
Cumulative Layout Shift is the third Core Web Vital, and it’s a brand-new one. This metric tries to figure out how ‘stable’ things load on your computer. It examines how much and by how much things bounce around when loading. You can imagine a button appearing on the screen from time to time, allowing users to press it while a broad content area is still being loaded in the background. What’s the result? The button pushes down a little when the material is completely loaded, just when you want to touch it. Frustration grows once more!
Ads are vulnerable to these layout changes. Many websites rely on advertising for sales, but they are often loaded in such a way that users are annoyed. Furthermore, several complex sites have so much going on that they are slow to load. This can also trigger content or CTAs to hop around on the screen, allowing slower-loading content to take their place.
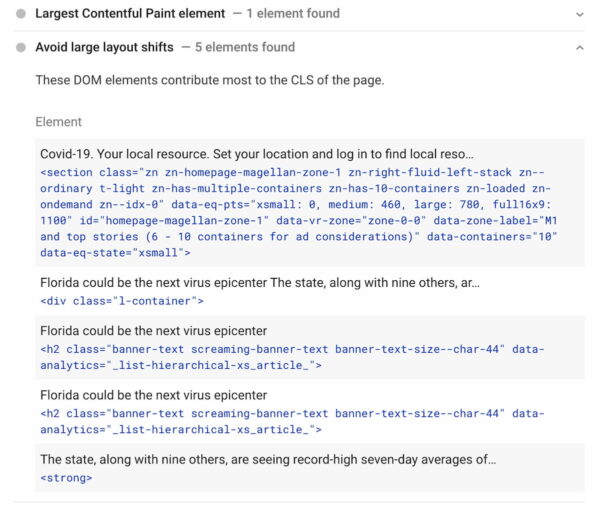
Take, for example, CNN.com. CNN’s website is no exception to the law that news websites are complicated and sluggish to load. On a PageSpeed Insights test, it gets a very low score. If you look at the issues and tips further down the list, you’ll see that at the time of writing, there are no fewer than five moving elements. Many elements hop about while loading this page, and it takes a while for it to settle and become useful. Users aren’t always careful, so they want to press a button as soon as it appears on the screen, only to miss it when a large ad appears in its place.
What You Should Do
To evaluate the movement of elements, the Cumulative Layout Shift compares frames. It measures the magnitude of layout changes by combining all of the points where they occur. Anything below 0.1 is considered fine by Google, but anything between 0.1 and 0.25 needs improvement. Anything over 0.25 is called bad.
Of note, the ranking only acknowledges abrupt layout shifts. If a fold-out menu appears after clicking the menu button as part of the style, then this does not count as a layout shift. However, if the button does cause a significant shift in design, you should make that clear to the user.
Ads, as I previously stated, are one of the key causes of this. They’re usually written in JavaScript and aren’t well-optimized, and they’re served from a third-party server. Every move adds to the slowness, and you’ll have to work hard to get your advertising to show in the right place at the right time. However, there is another factor that contributes to major interface changes: images.
Developers don’t often define the width and height of an image in the code, instead of relying on the browser to determine how the image should be shown on the page. When browsing a page that includes both images and text, the text will appear first, followed by the images. If the creator hasn’t set aside space for these files, the top portion of the loading page will be loaded with text, encouraging them to begin reading. The photographs, on the other hand, load later and appear in the same place as the text. This causes the user to become irritated when the text is pushed down. So, make sure to define the width and height of CSS images to ensure that there is enough room for the images to load.
Web Vitals Measuring Tools
There are various resources available to assist you in tracking Web Vitals and optimizing your site’s efficiency:
- PageSpeed Insights: With both field and lab results, PageSpeed Insights has developed into a full-service measurement tool. You will also be able to get advice on focal points to improve on.
- Lighthouse: Aside from SEO checks and several audits, it is also a great tool to assess performance.
- Search Console Core Web Vitals report: Straight from Search Console, you can now get insights on your site performance.
- Chrome Developer Tools: Core Web Vitals report and Core Web Vitals overlay are some of the now available developer tools from Chrome.